Elasticsearch provides a search engine, Kibana is a web interface for working with Elasticsearch, Logstash is a tool for collecting logs and transferring them to Elasticsearch. Thus, the Elasticsearch + Kibana + Logstash (or ELK Stack) bundle is a tool for collecting and storing operating system logs. It supports different platforms (Windows, Linux, BSD).
In this manual, we will consider an example of installing the ELK server part version 8 on Linux Ubuntu. We will also set up logging with CentOS and Ubuntu.
Before we start, let’s prepare our server for installation and configuration.
1. Update apt cache
apt update2. Selecting the installation method for ELK
We will look at two ways to install ELK stack software products – from the official repository and using a deb file.
a) To work with the repository.
This method is preferred. It is more convenient and faster to work with.
Import the GPG key for the repository:
wget -qO - [<https://artifacts.elastic.co/GPG-KEY-elasticsearch>](<https://artifacts.elastic.co/GPG-KEY-elasticsearch>) | sudo apt-key add -Installing the package:
apt install apt-transport-httpsWe create a file:
nano /etc/apt/sources.list.d/elastic-8.x.listdeb [signed-by=/usr/share/keyrings/elasticsearch-keyring.gpg]
https://artifacts.elastic.co/packages/8.x/apt stable mainLet’s update the cache for the added repository:
apt-get update -o Dir::Etc::sourcelist="/etc/apt/sources.list.d/elastic-8.x.list"b) To download deb files.
This method is suitable if access to the ELK repository is blocked for our IP address. In this case, you can download the installation file using a VPN or proxy.
Well, or we just like this method better – then if we have access to download from the ELK website, we need a utility for downloading files – we put it on the server:
apt install wgetFirewall settings:
Open ports for ELK:
iptables -I INPUT -p tcp --dport 5044 -j ACCEPT
iptables -I INPUT -p tcp --dport 5601 -j ACCEPT
where:
     5044 - the port on which Logstash listen.
     5601 - Kibana.
To save the rules, use the iptables-persistent utility:
apt install iptables-persistentnetfilter-persistent saveJava installation
All software products of the ELK stack are developed in Java, so they will not work without the appropriate platform on the server. To do this, we will install the openjava package:
apt install default-jdkAfter the installation is complete, you can enter the command:
java -versionIt should return something like this:
openjdk version "11.0.15" 2022-04-19
OpenJDK Runtime Environment (build 11.0.15+10-Ubuntu-0ubuntu0.20.04.1)
OpenJDK 64-Bit Server VM (build 11.0.15+10-Ubuntu-0ubuntu0.20.04.1, mixed mode, sharing)
Elasticsearch
Consider the installation in two ways.
a) Use the repository
apt install elasticsearchb) Deb file
Go to the elastic download page and download the DEB package or copy the link to it:
https://www.elastic.co/downloads/elasticsearch
We transfer the file to the server or upload it to the server using the copied link:
wget https://artifacts.elastic.co/downloads/elasticsearch/elasticsearch-8.2.3-amd64.debAfter we install elastic on our server:
dpkg -i elasticsearch-*.debAfter installation
Upon completion of the installation, we should see a message:
----------------- Security autoconfiguration information --------------------
...
The generated password for the elastic built-in superuser is : MFVg1a6NpglV69yci_rr
...
-----------------------------------------------------------------------------*where MFVg1a6NpglV69yci_rr is the password for the elastic user. We write it down – we will need it later.
We allow autostart of the service and start it:
systemctl enable elasticsearch --nowChecking the functionality of the service:
curl -k -u elastic:MFVg1a6NpglV69yci_rr https://localhost:9200Install Kibana
Just like with Elasticsearch, we will consider installation in two ways.
a) Use the repository
We enter the command:
apt install kibanab) Deb file
Go to the Kibana download page and download the link to the latest version of the DEB package:
On a computer with access to the ELK website, download the package for installing kibana from it:
wget https://artifacts.elastic.co/downloads/kibana/kibana-8.2.3-amd64.debOr in the browser. After we transfer the package to the target server and install the application:
dpkg -i kibana-*.debAfter installation
Open the configuration file for editing:
nano /etc/kibana/kibana.ymlEdit the host parameter:
server.host: 192.168.1.10Allow Kibana autostart and restart it:
systemctl enable kibana
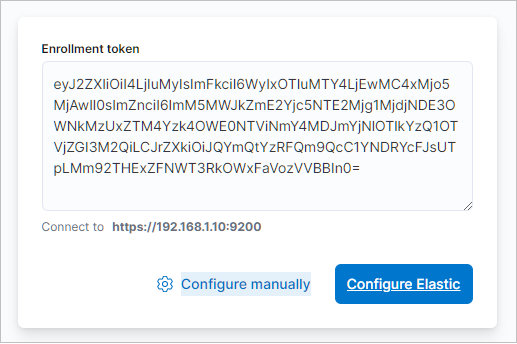
systemctl restart kibanaOpen a browser and follow the link http://<server IP address>:5601. We should see the token input form.
Go to the server and enter the command to get the token:
/usr/share/elasticsearch/bin/elasticsearch-create-enrollment-token -s kibanaA sequence of characters will be displayed on the screen – copy it and paste it into Kibana. Click on Configure Elastic:
A window will open asking you to enter a verification code. We return to the server and enter the command:
/usr/share/kibana/bin/kibana-verification-codeWe will get a 6 digit code. Enter it in the Kibana window:
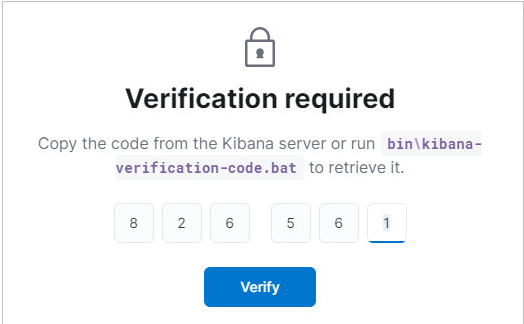
Click Verify – the setup process will begin. After its completion, we will see a login and password entry window. We stop at this for now and move on to configuring Logstash.
Install Logstash
Separately, consider the installation from the repository, using the deb file and configuration.
a) Use the repository
Enter the command:
apt install logstashb) Deb file
The process of installing Logstash is similar – go to the download page of the software product, copy the link to the DEB package:
Download the package on our server (or another computer and transfer it to the server):
wget https://artifacts.elastic.co/downloads/logstash/logstash-8.2.3-amd64.deb…and install it:
dpkg -i logstash-*.deb
Configuring Logstash:
Allow autostart and start the service:
systemctl enable logstash
systemctl start logstash
Logstash settings are stored in the /etc/logstash/conf.d directory in JSON files. The following sections are used for configuration:
- input.
- filter.
- output.
For each of them we will create our own file.
nano /etc/logstash/conf.d/input.conf
______________________________________
input {
  beats {
    port => 5044
  }
}
in this example, we configured logstash to accept logs on port 5044.
nano /etc/logstash/conf.d/filter.conf
_________________________________________
filter {
  if [type] == "syslog" {
    grok {
      match => { "message" => "%{SYSLOGTIMESTAMP:syslog_timestamp} %{SYSLOGHOST:syslog_hostname} %{DATA:syslog_program}(?:\\[%{POSINT:syslog_pid}\\])?: %{GREEDYDATA:syslog_message}" }
      add_field => [ "received_at", "%{@timestamp}" ]
      add_field => [ "received_from", "%{host}" ]
    }
    date {
      match => [ "syslog_timestamp", "MMM  d HH:mm:ss", "MMM dd HH:mm:ss" ]
    }
  }
}
nano /etc/logstash/conf.d/output.conf
______________________________________
output {
  elasticsearch {
    hosts => ["<https://localhost:9200>"]
    ssl => true
    ssl_certificate_verification => false
    manage_template => false
    index => "%{[@metadata][beat]}-%{[@metadata][version]}-%{+YYYY.MM.dd}"
    user => elastic
    password => "MFVg1a6NpglV69yci_rr"
  }
}
You can check the configuration with the command:
/usr/share/logstash/bin/logstash --path.settings /etc/logstash -tWe should see:
Configuration OK
Restart the logstash service:
systemctl restart logstashLet’s wait a bit – the application needs about 1 minute to start. After entering the command:
ss -tunlp | grep 5044… we will see something like:
tcp LISTEN 0 128 :::5044 :::* users:(("java",pid=11745,fd=114))The service has started and is ready to receive logs.